All research
2026Aircraft Systems Laboratory · UC Irvine

Mapping Propeller Noise Across Scales

Building the equipment, learning through each version, and putting my ideas to the test.

Boyang Chen · Faculty mentor: Prof. Jacqueline Huynh

Three generations of learning

I led the modeling, design, and construction of our lab's anechoic chamber. Building the equipment inside it has been a meaningful design and learning journey: from a mini test stand controlled by analog signals, to a mobile stand with precise digital RPM control, and now Test Stand V3 with stepper positioning, infrared sensors for RPM control, and load cells for force measurements.
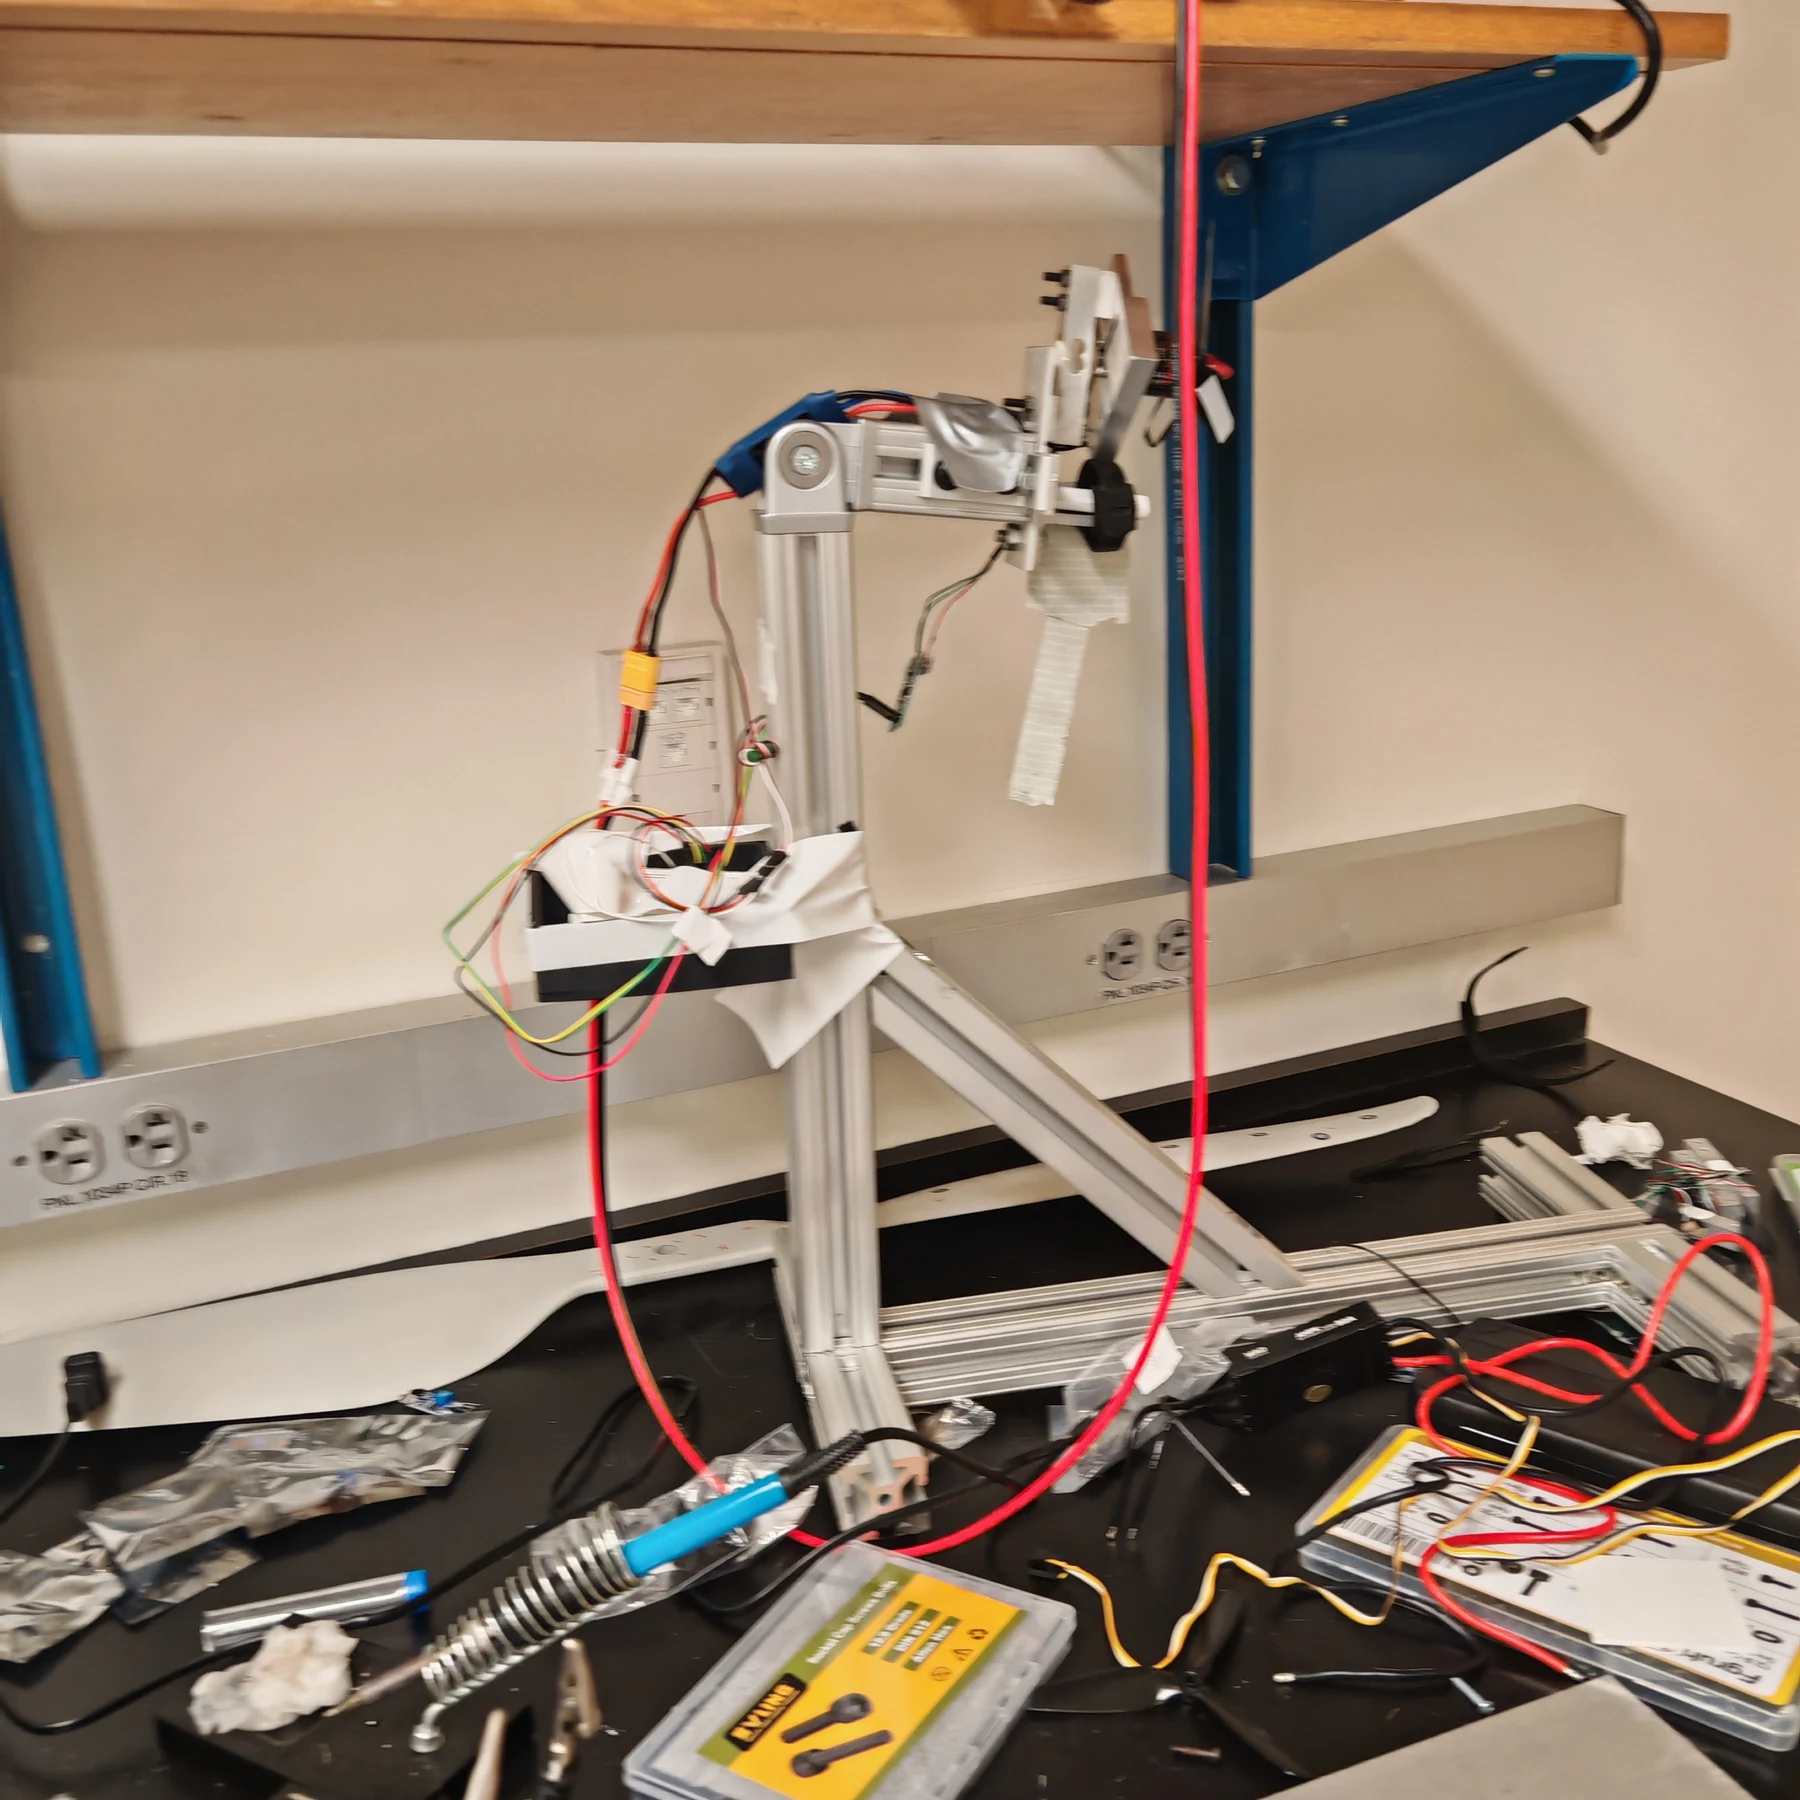
The first mini test stand on a lab bench, with its aluminum frame, propeller mount, and breadboard wiring
Test Stand V1: my first mini test stand, controlled by analog signals.
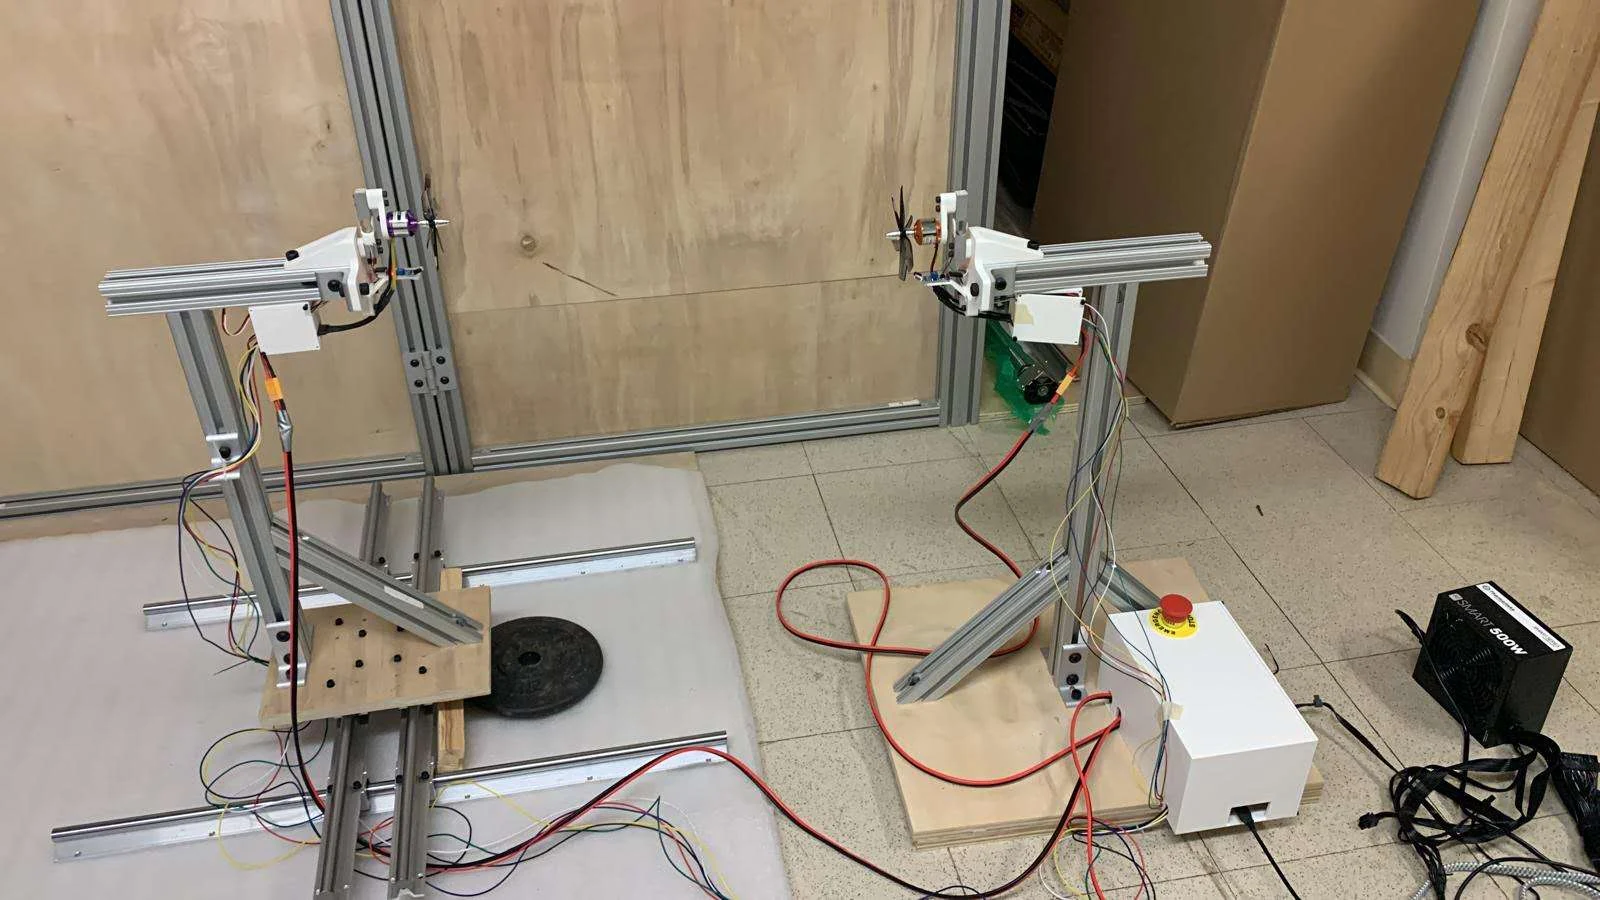
Two mobile propeller test stands with aluminum frames and control wiring in the lab
Test Stand V2: a mobile setup with precise digital RPM control.
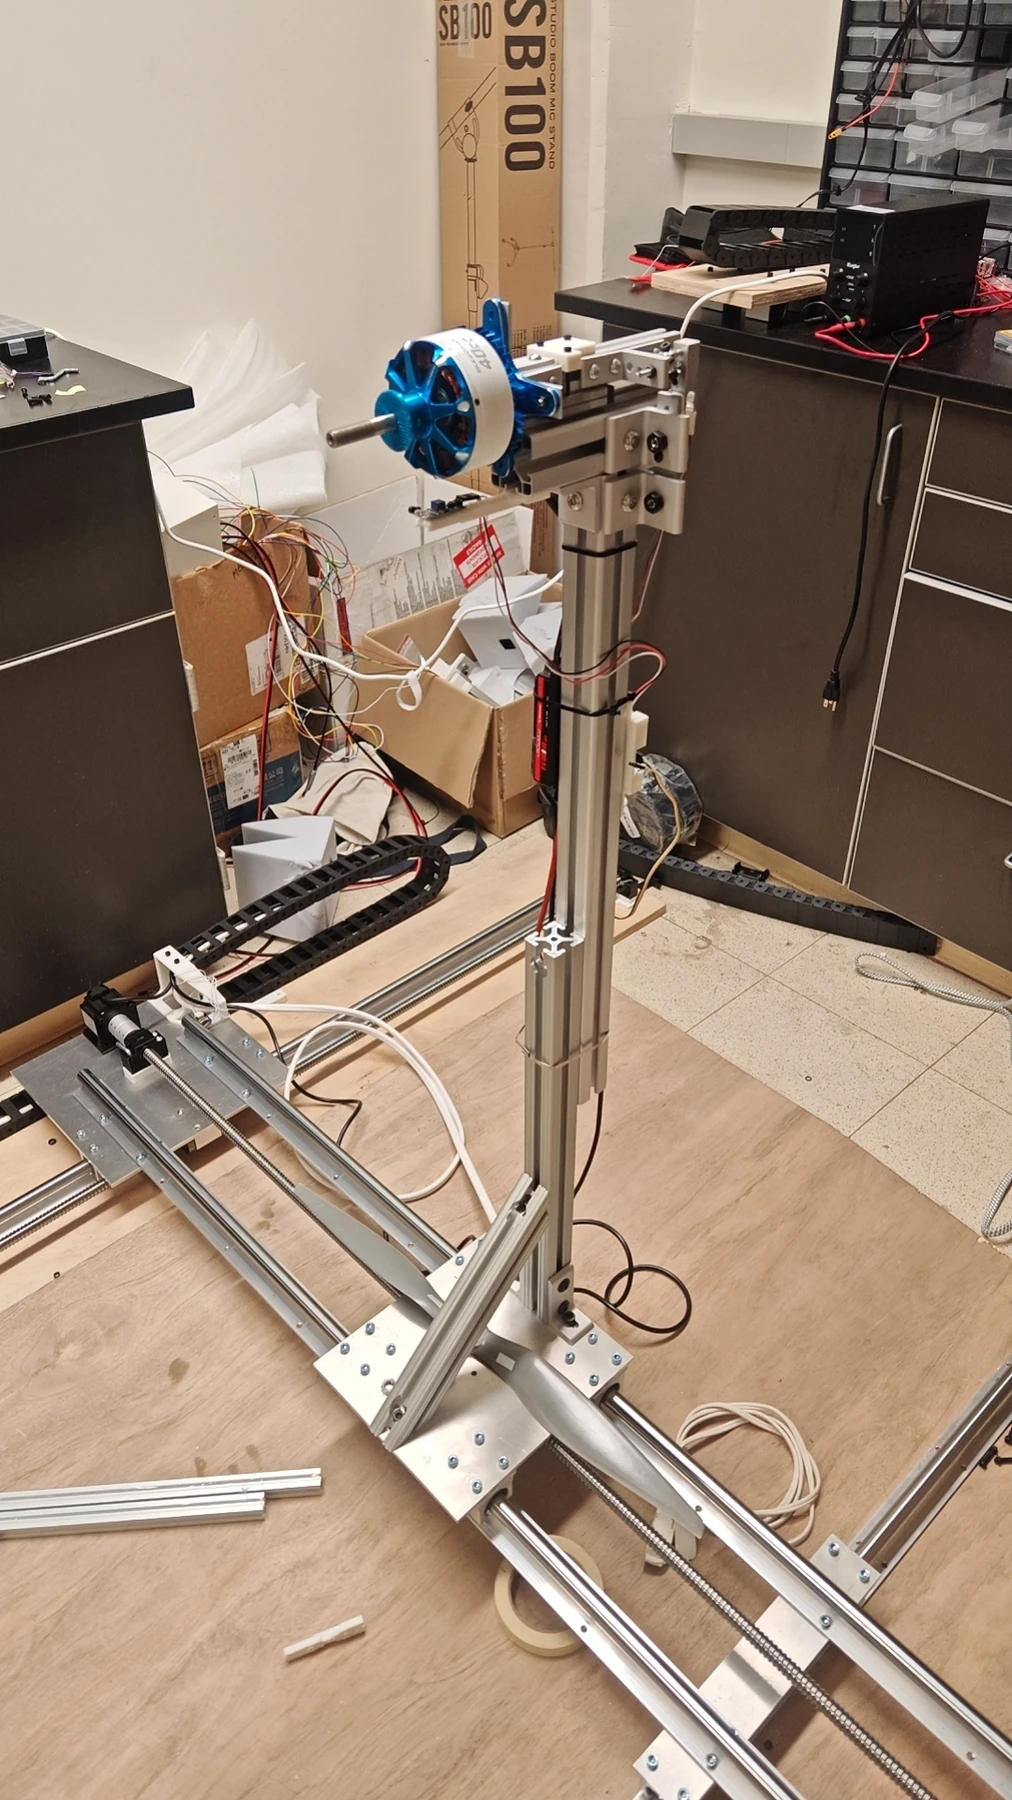
Test Stand V3 with a propeller motor, load cell mount, and motorized positioning rails
Test Stand V3: stepper positioning, infrared RPM control, and load cell measurements.
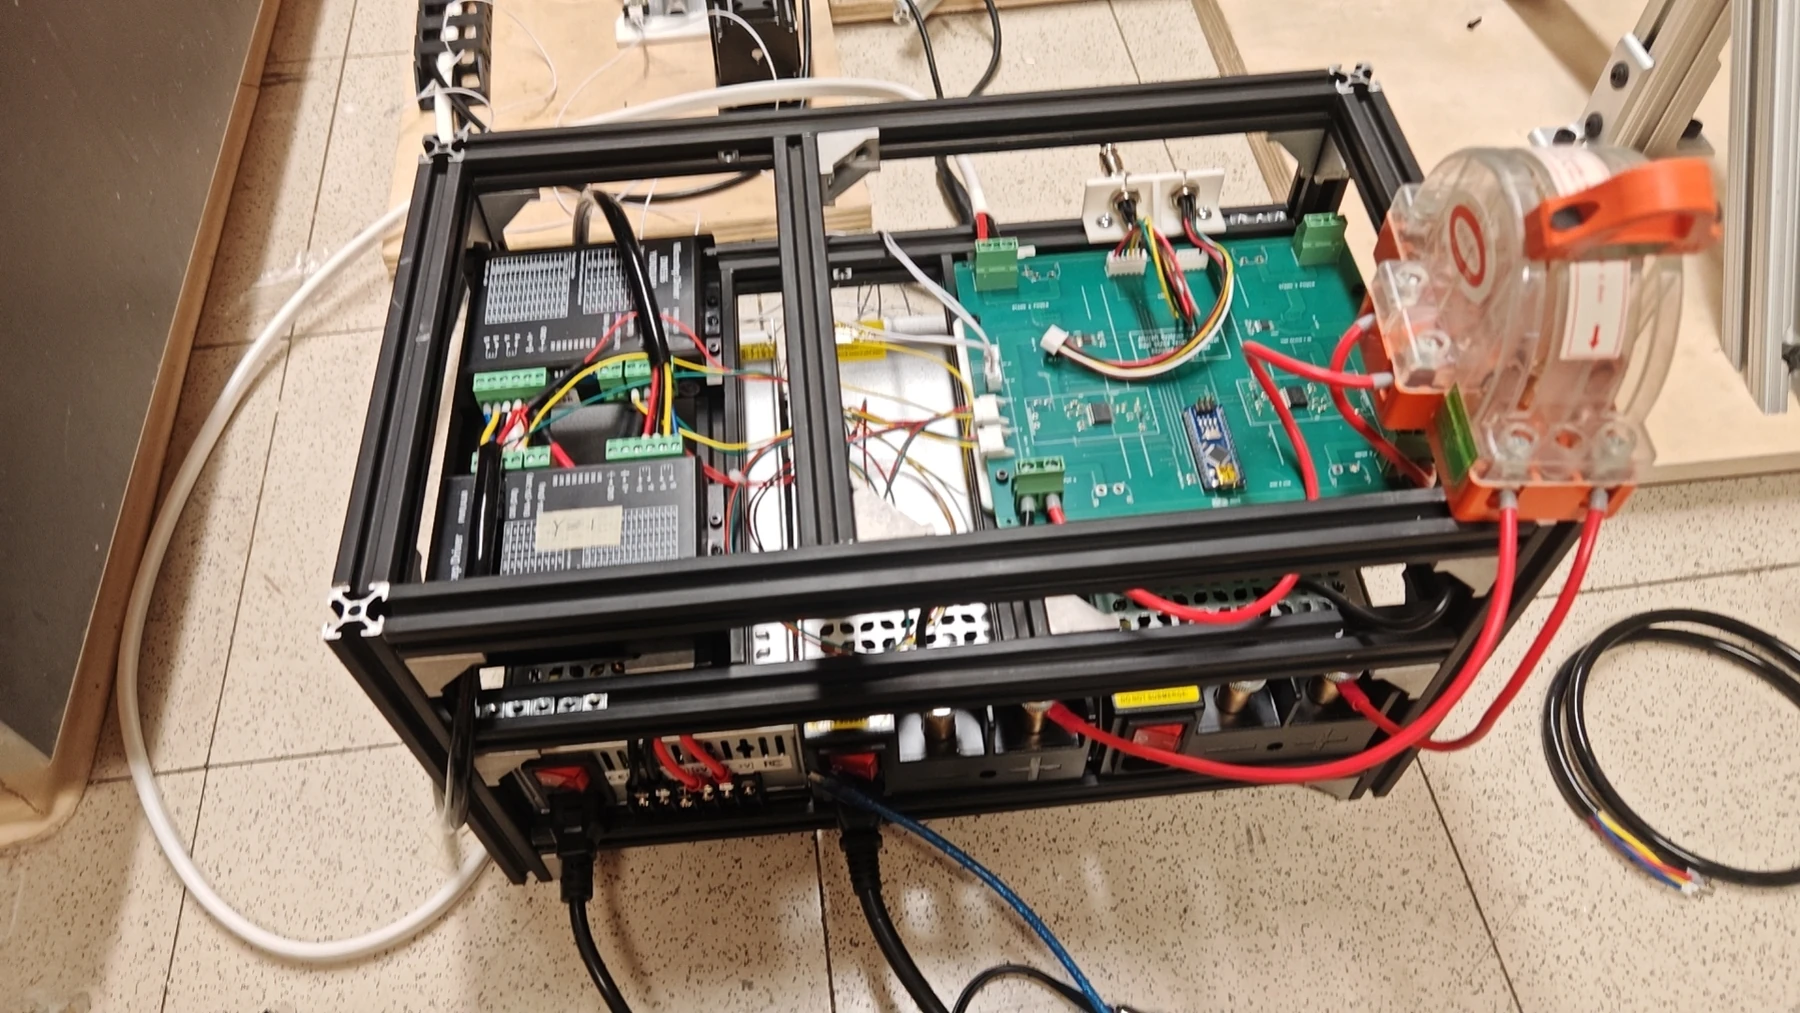
The assembled power and control unit with power supplies, motor drivers, and the main control PCB in an aluminum frame
The power and control unit for Test Stand V3.

From SolidWorks to my first PCB

I designed all the hardware and software myself, from the SolidWorks models and material selection to assembly and code. The software improved with each generation, alongside the hardware.
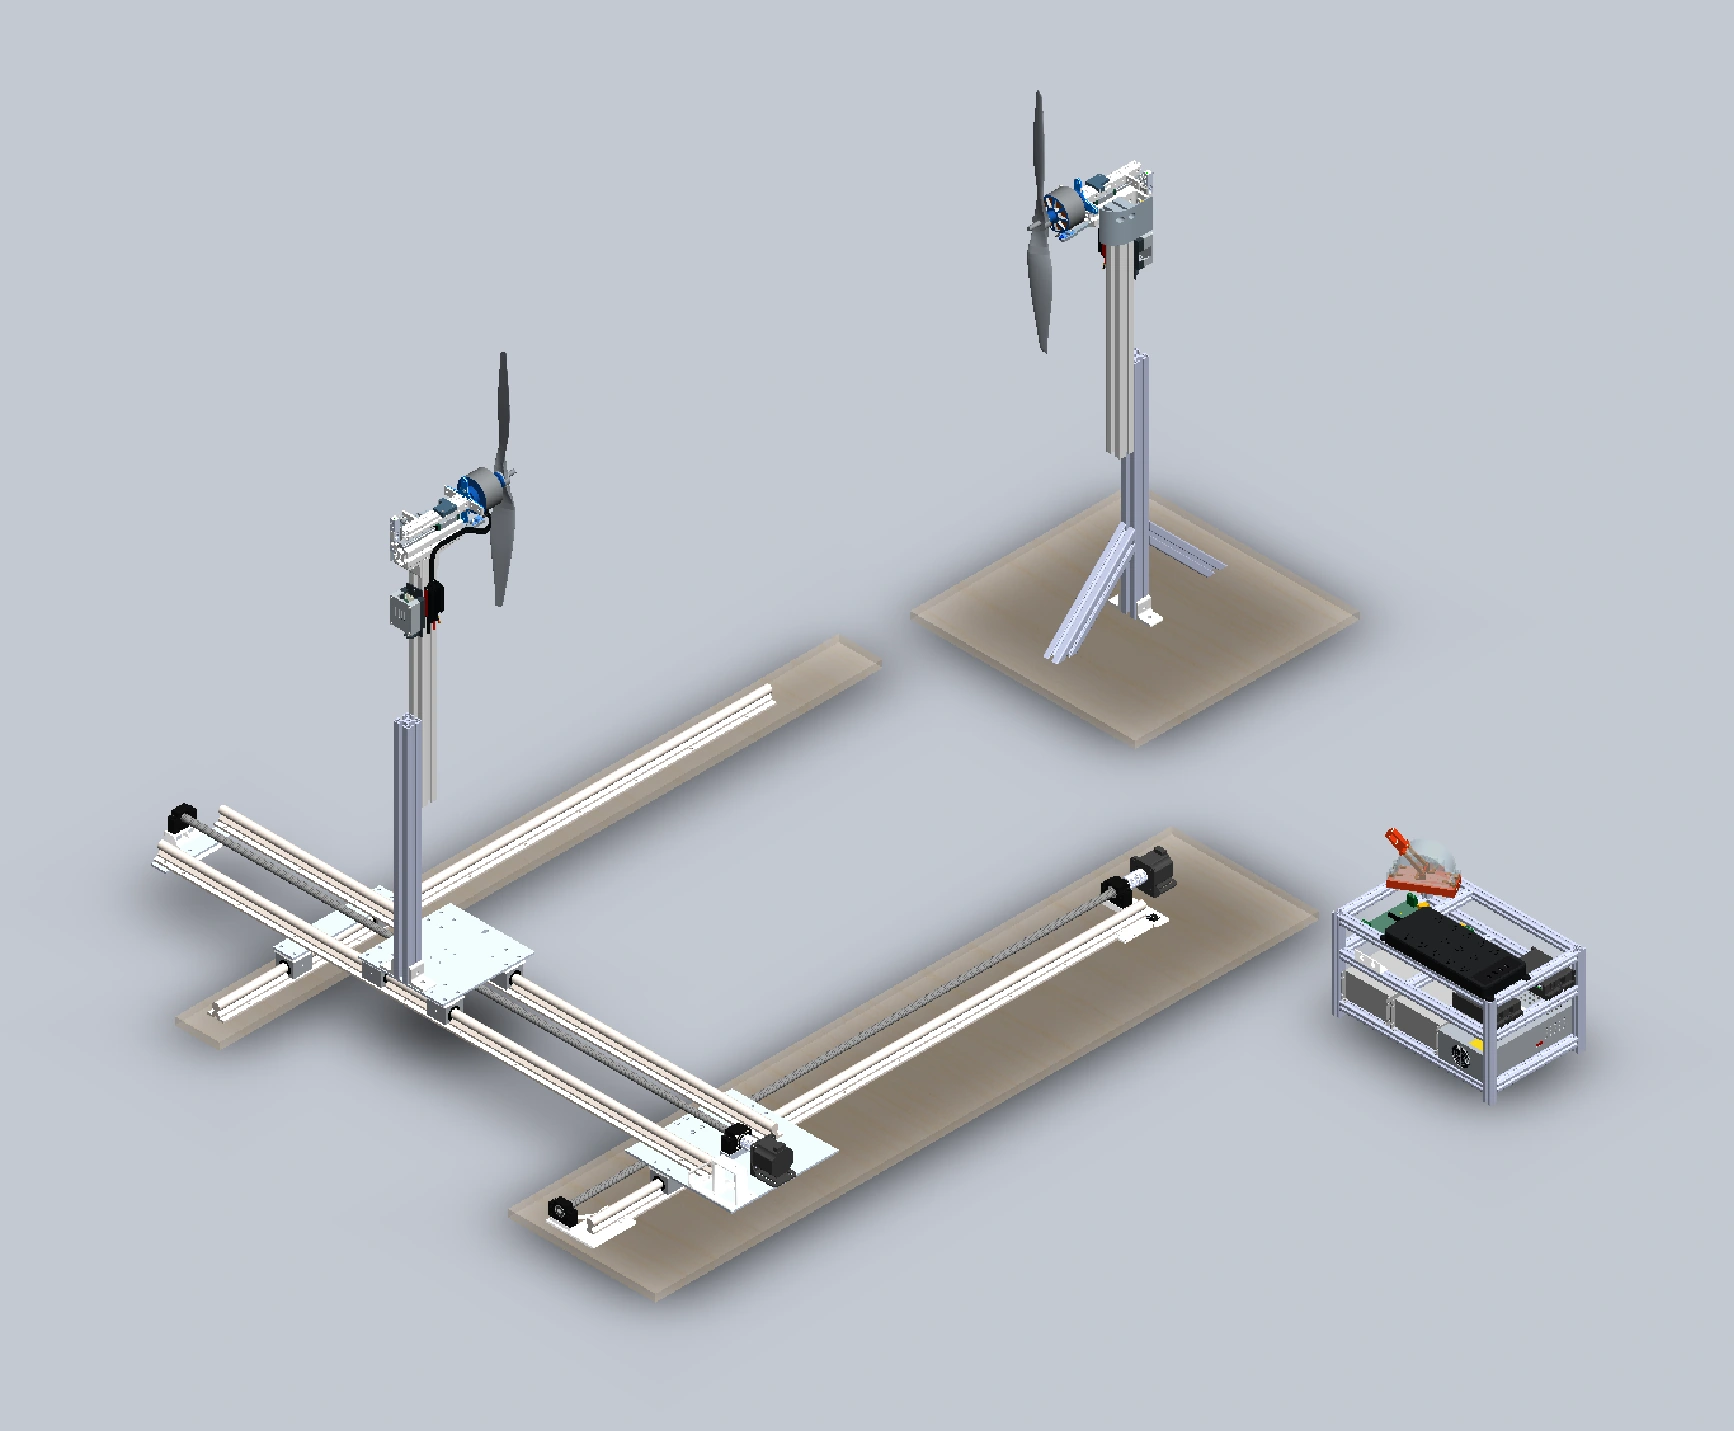
SolidWorks rendering of my full assembly with two propeller test stands, motorized positioning rails, and a separate power station
My full test stand assembly in SolidWorks, with the mobile platform, fixed stand, and power station.

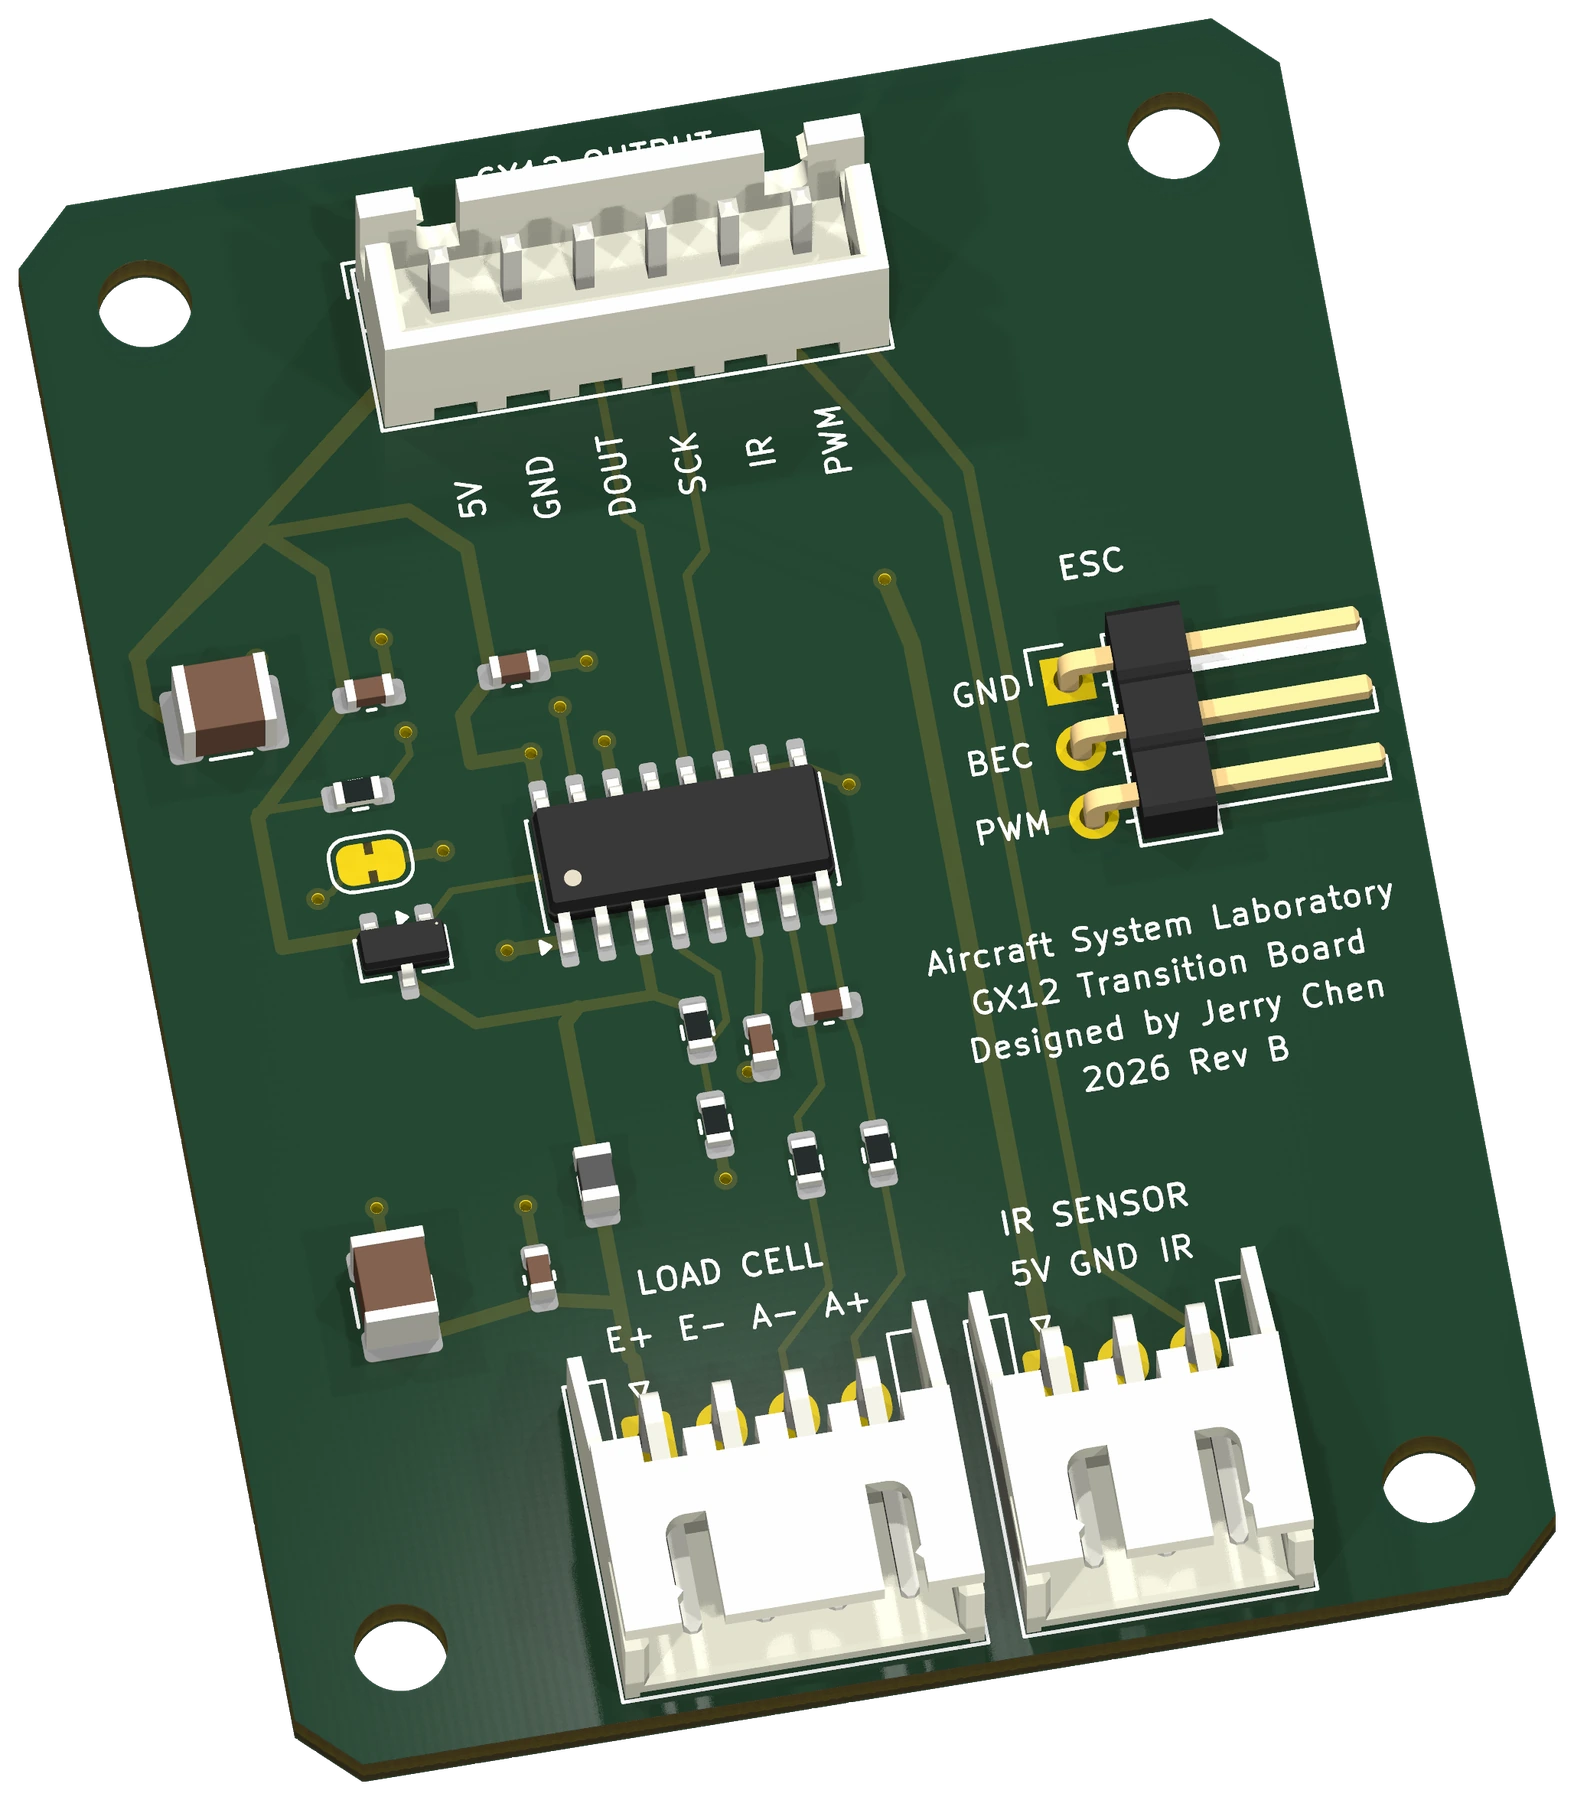
As the wiring grew, I moved from Arduino and breadboards to a PCB to bring it all together. It was the first PCB I had ever designed. The setup now has a power and control board and a smaller sensor interface board.
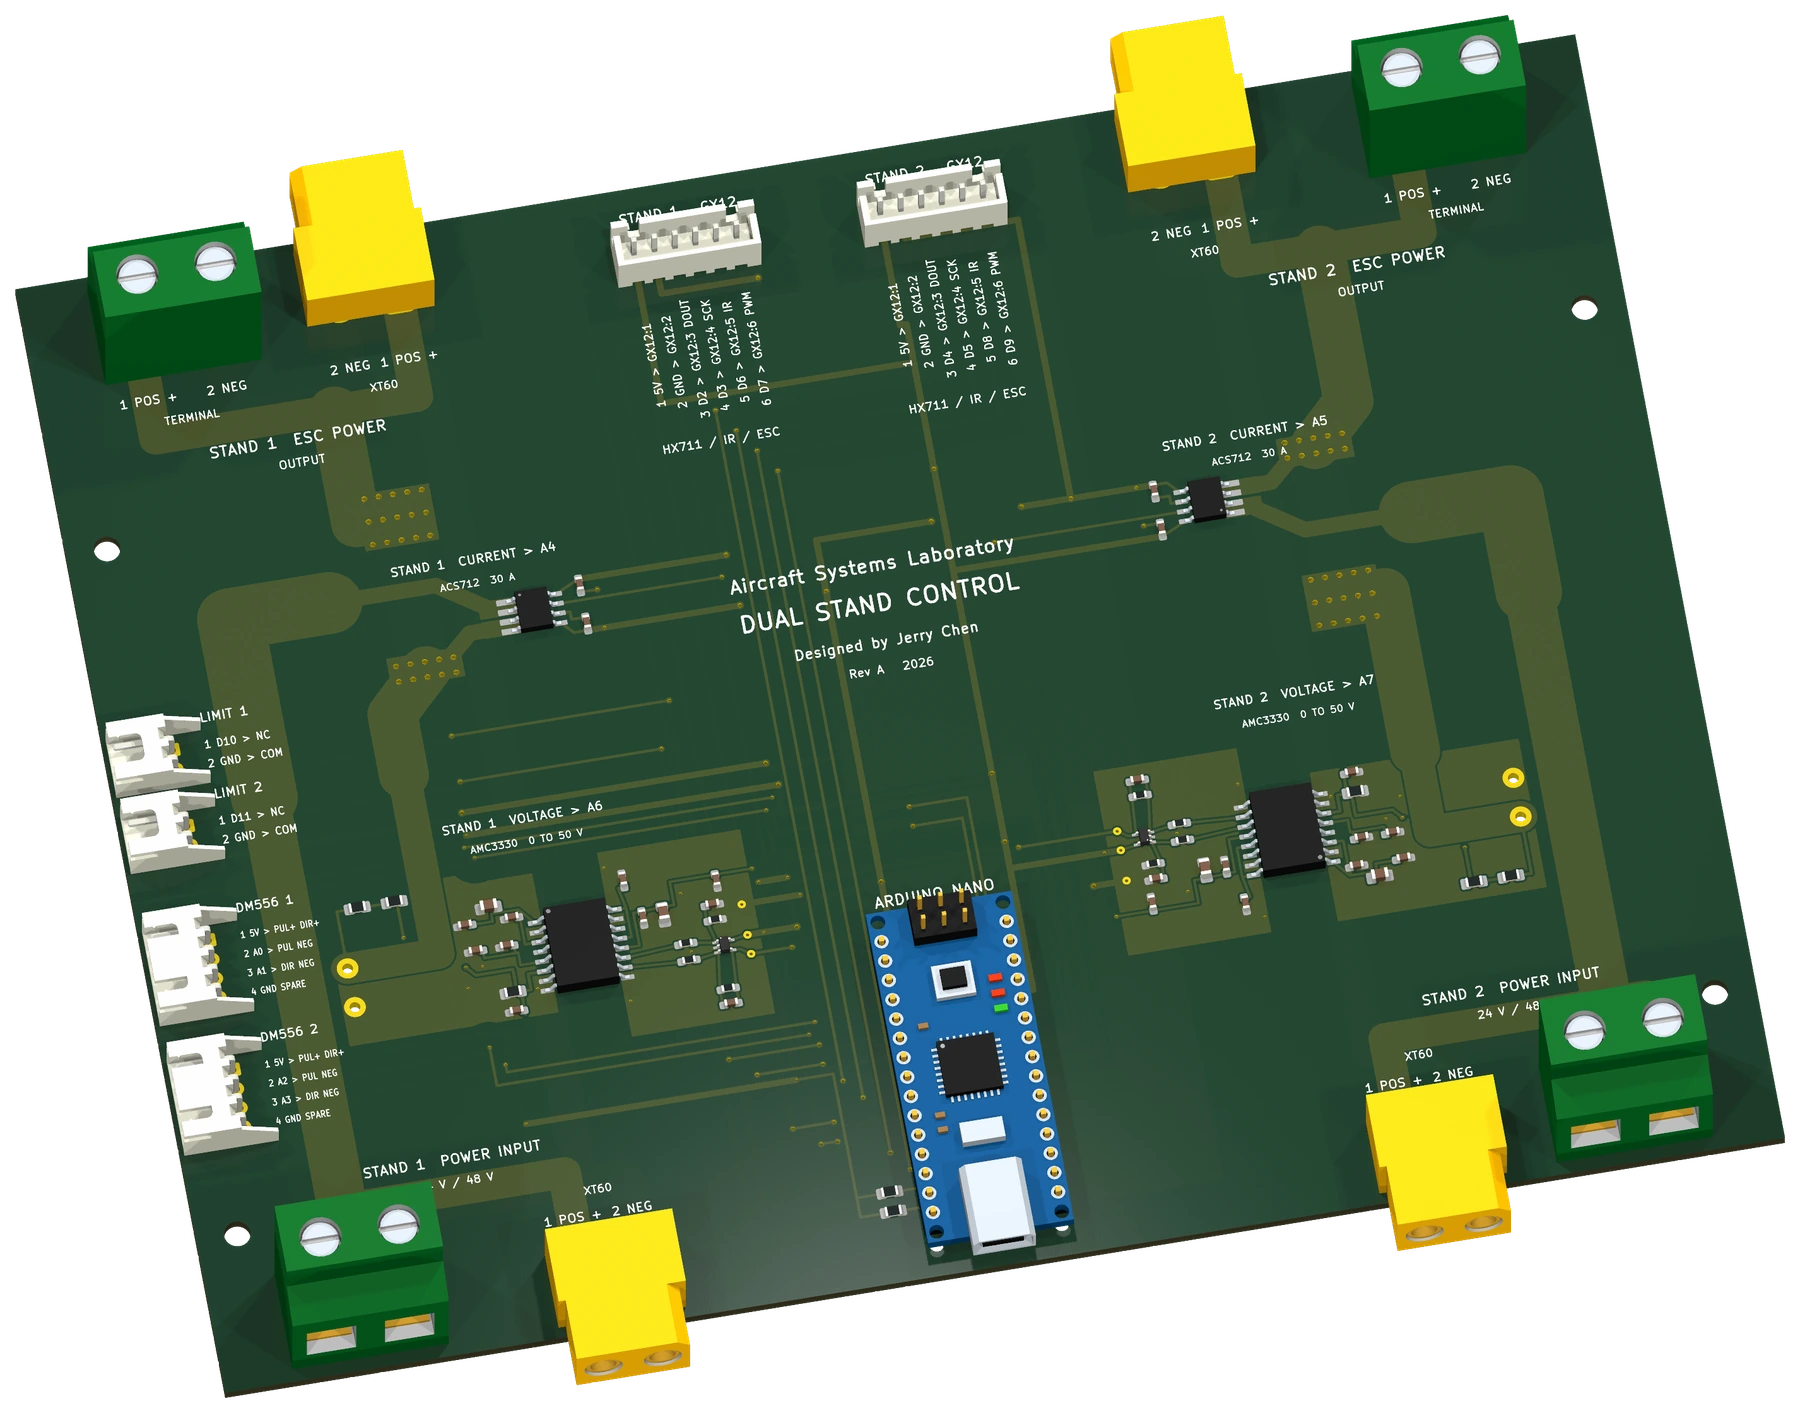
Render of the Dual Stand Control PCB with an Arduino Nano, power connectors, and control interfaces
My custom PCB for power distribution and test stand control.
Render of the GX12 sensor interface PCB with load cell, infrared sensor, and ESC connections
The sensor interface connects the load cell, infrared RPM sensor, and ESC.

Prof. Jacqueline Huynh's guidance and help have been an important part of this process. Each version gave me something new to learn and another chance to improve the design.
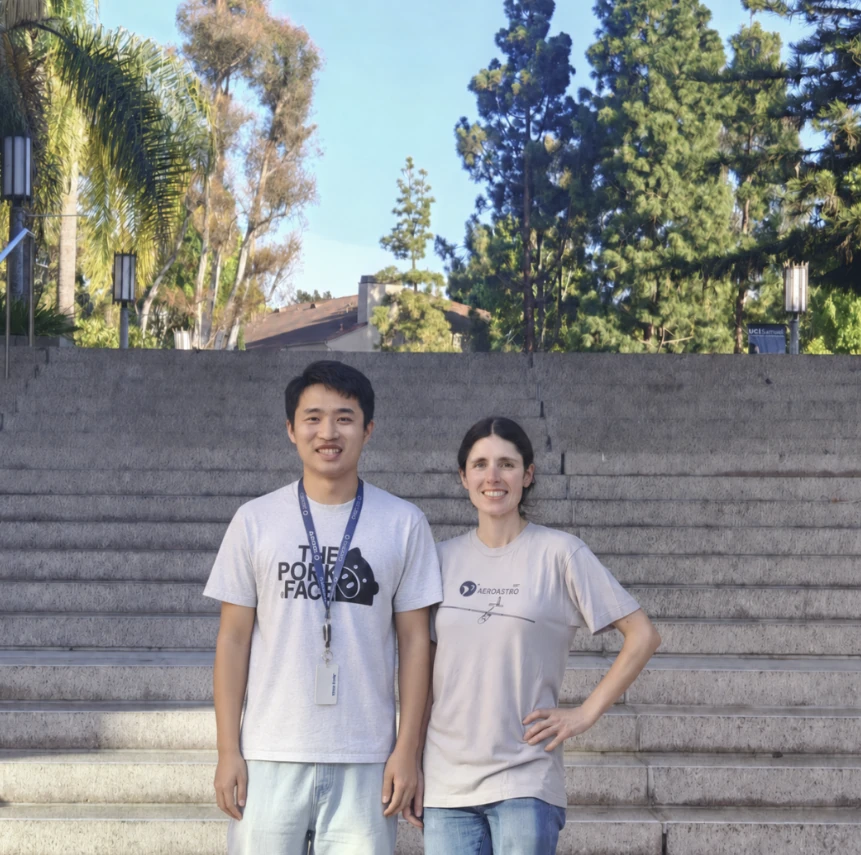
Me with Prof. Jacqueline Huynh outdoors
With my mentor, Prof. Jacqueline Huynh.
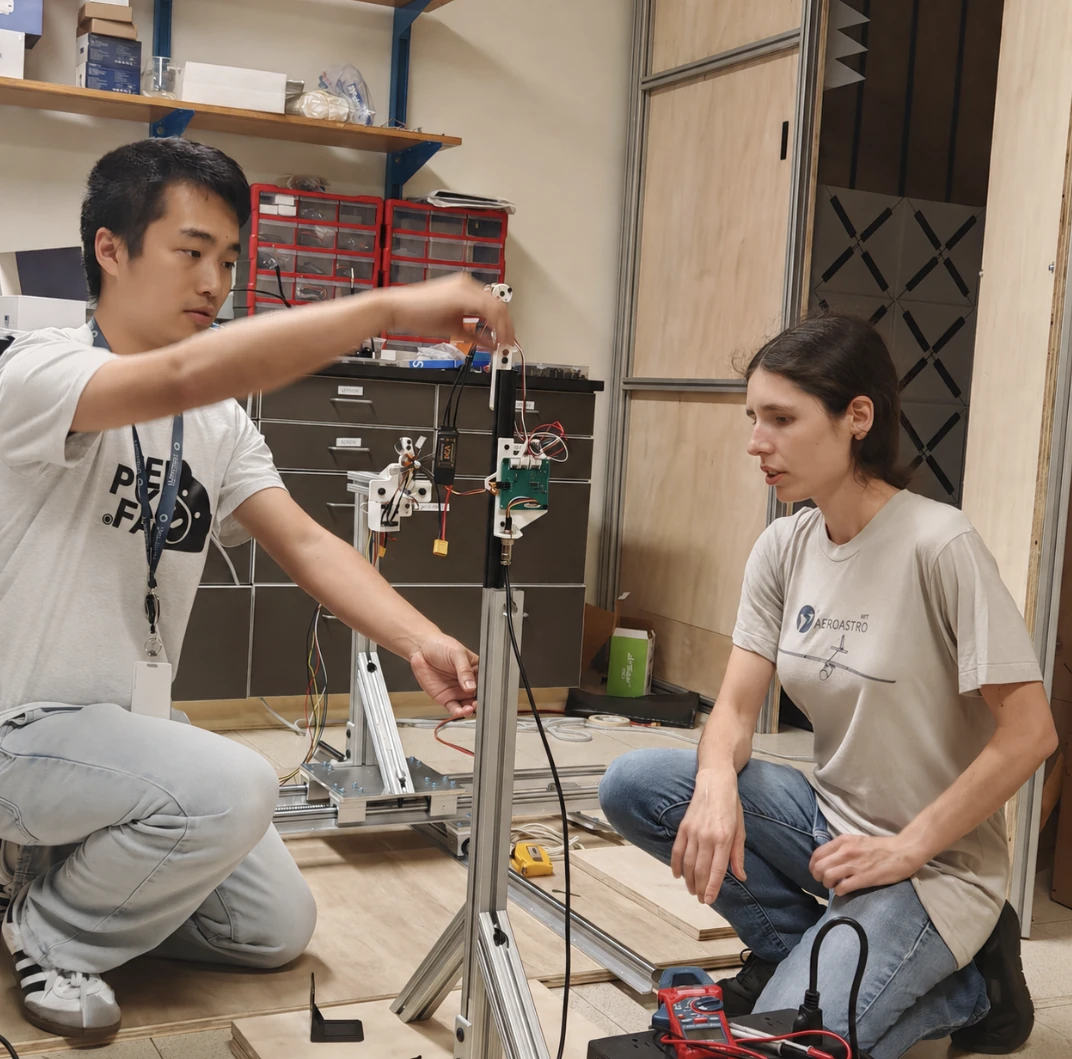
Me discussing a test stand design with Prof. Jacqueline Huynh in the lab
Working through my test stand design with Prof. Jacqueline Huynh.

This equipment has also welcomed several groups of visiting middle and high school students. Letting them control the setup and experience the research process has been especially meaningful to me.

The first experiments

Can experiments with small propellers tell us something about noise at larger scales? The first measurements at 6, 13, and 40 cm show a clear pattern across all three sizes. Their noise levels differ, but they change in similar ways as the spacing changes. Seeing that in the first results was exciting, and gave me a reason to keep exploring.

D = 6 cm

17,040 rpm per rotor
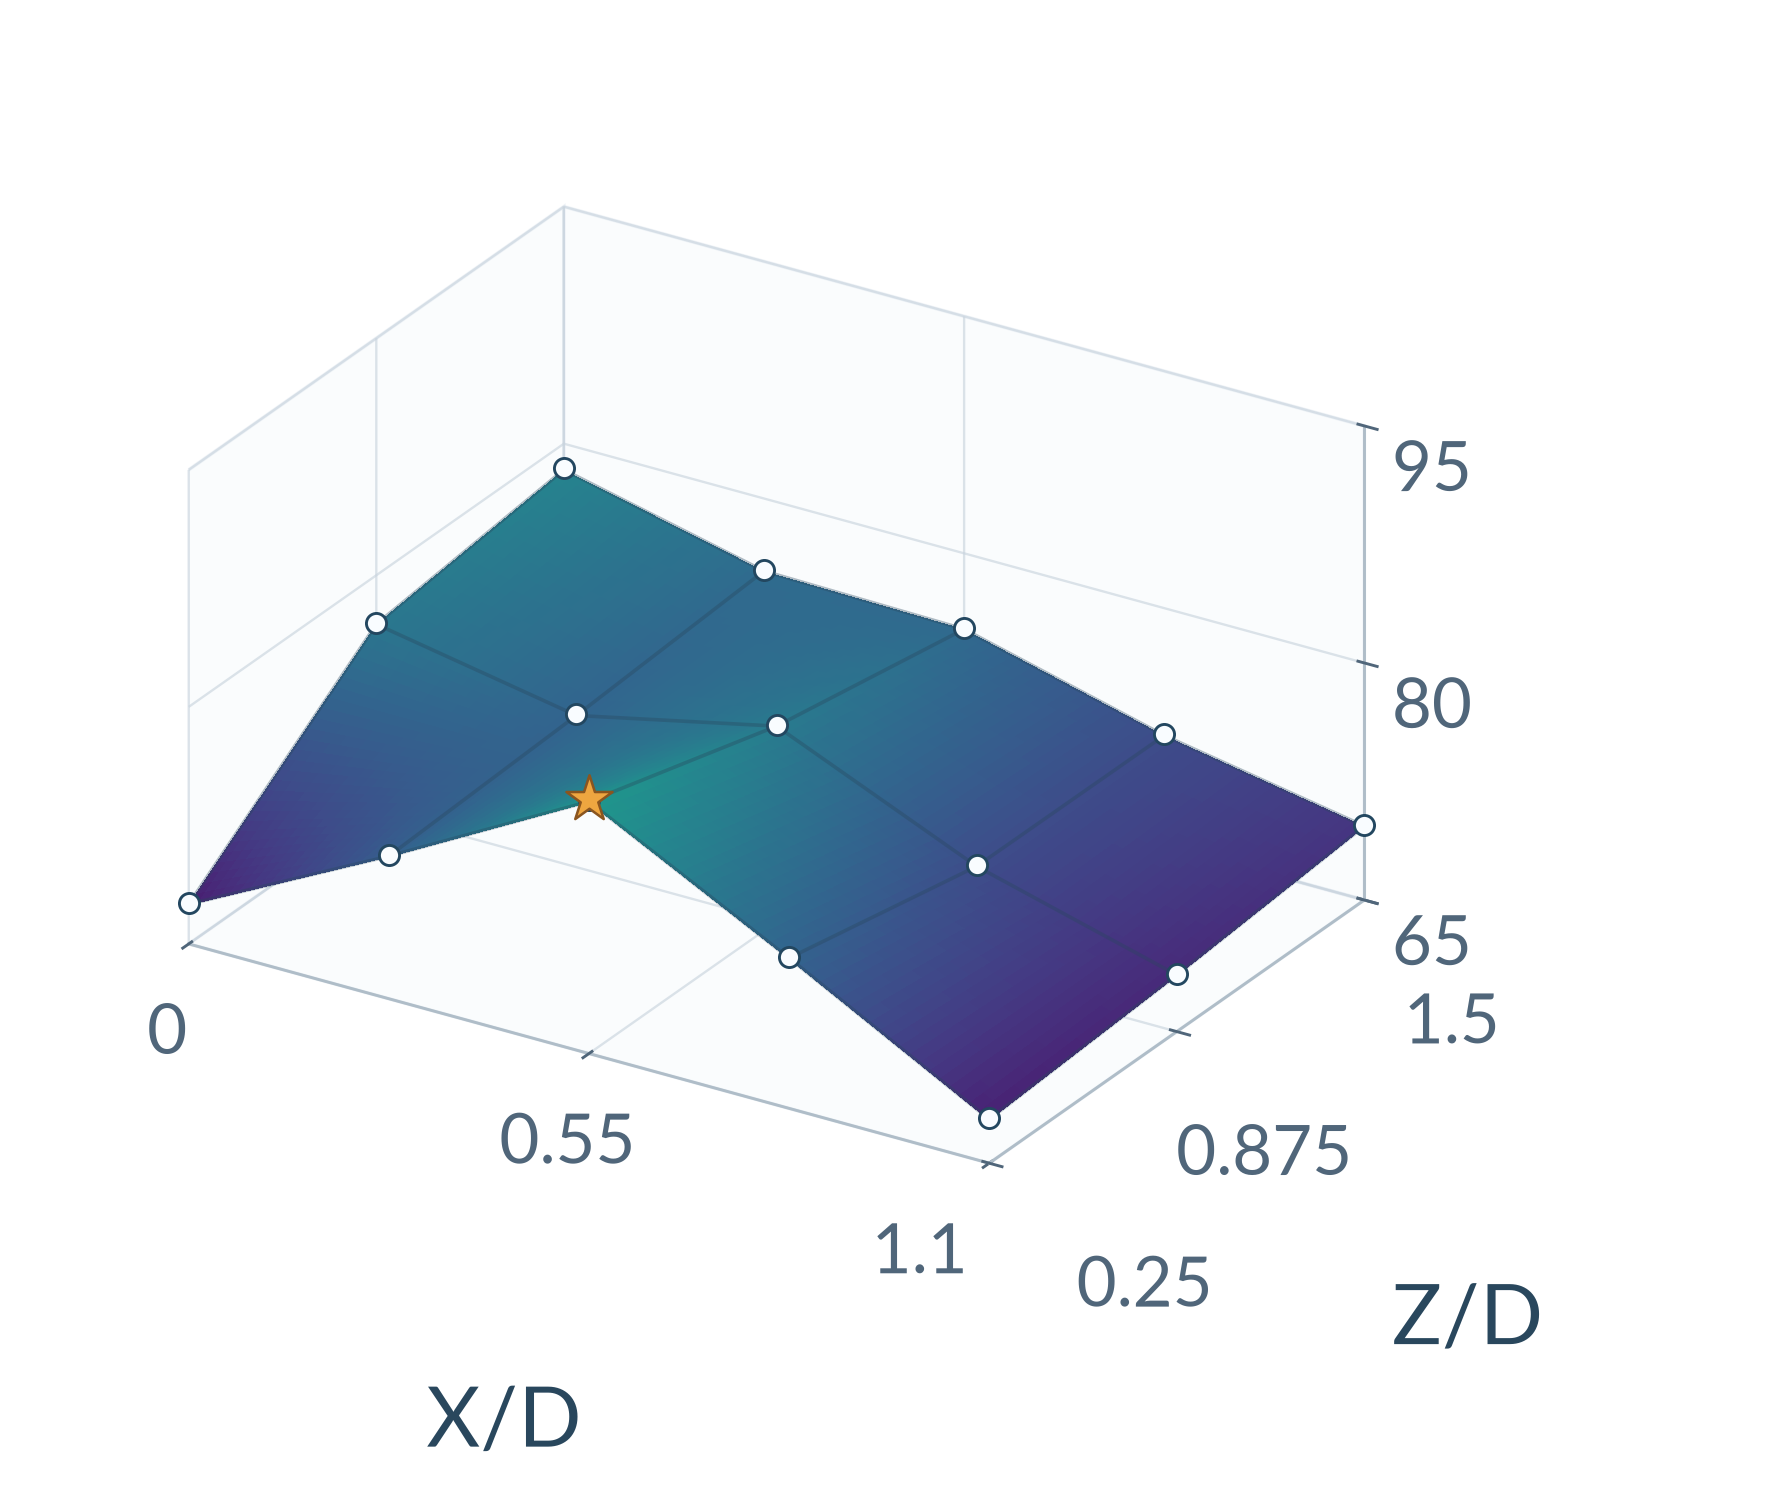
Preliminary sound level surface for 6 cm propellers across lateral offset X/D and axial spacing Z/D

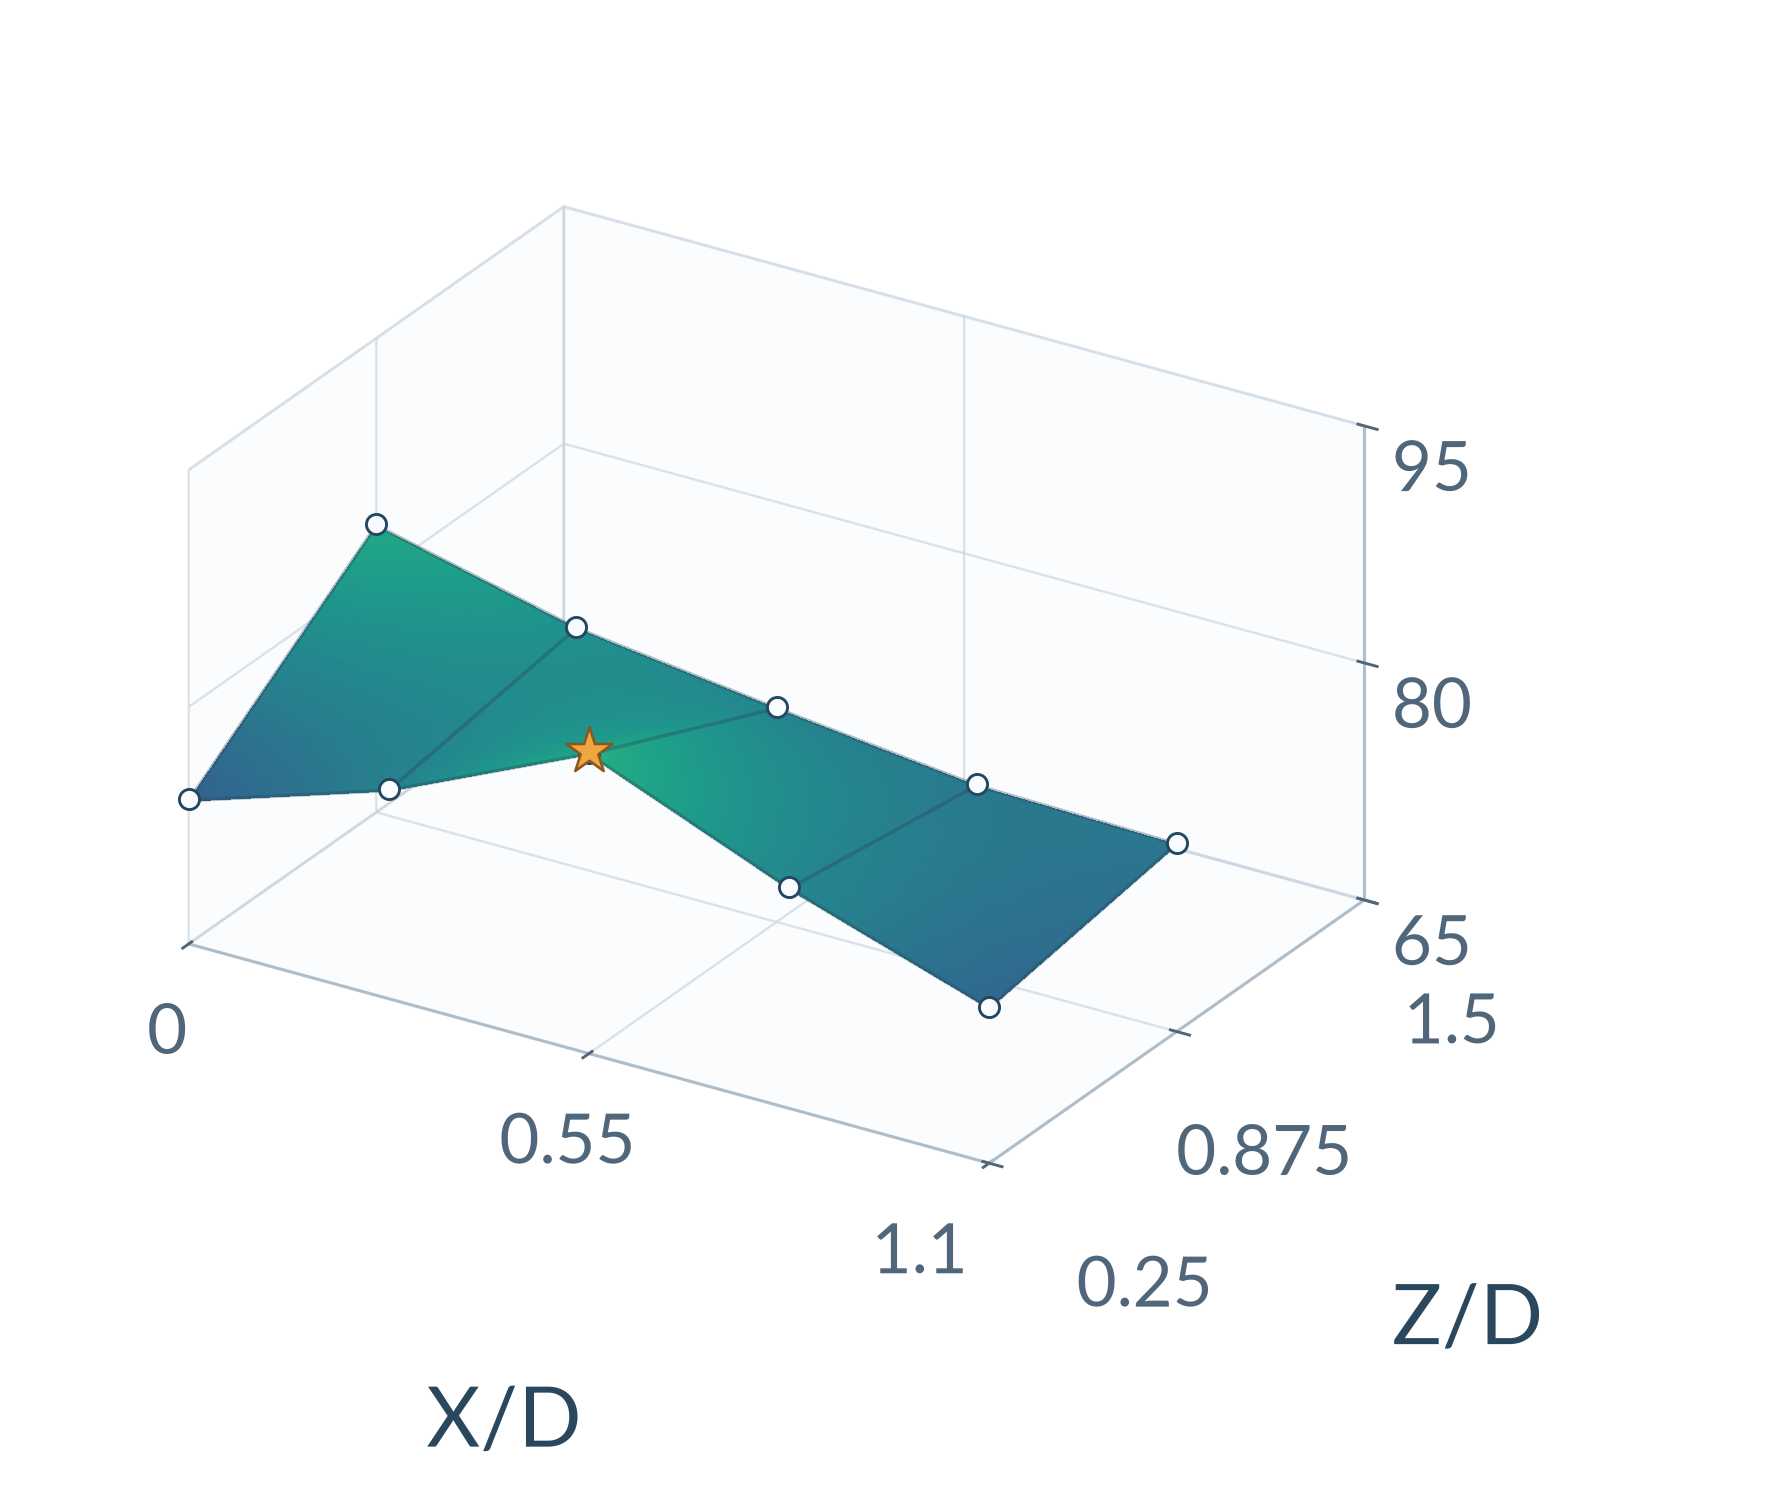
D = 13 cm

7,819 rpm per rotor

Preliminary sound level surface for 13 cm propellers across lateral offset X/D and axial spacing Z/D

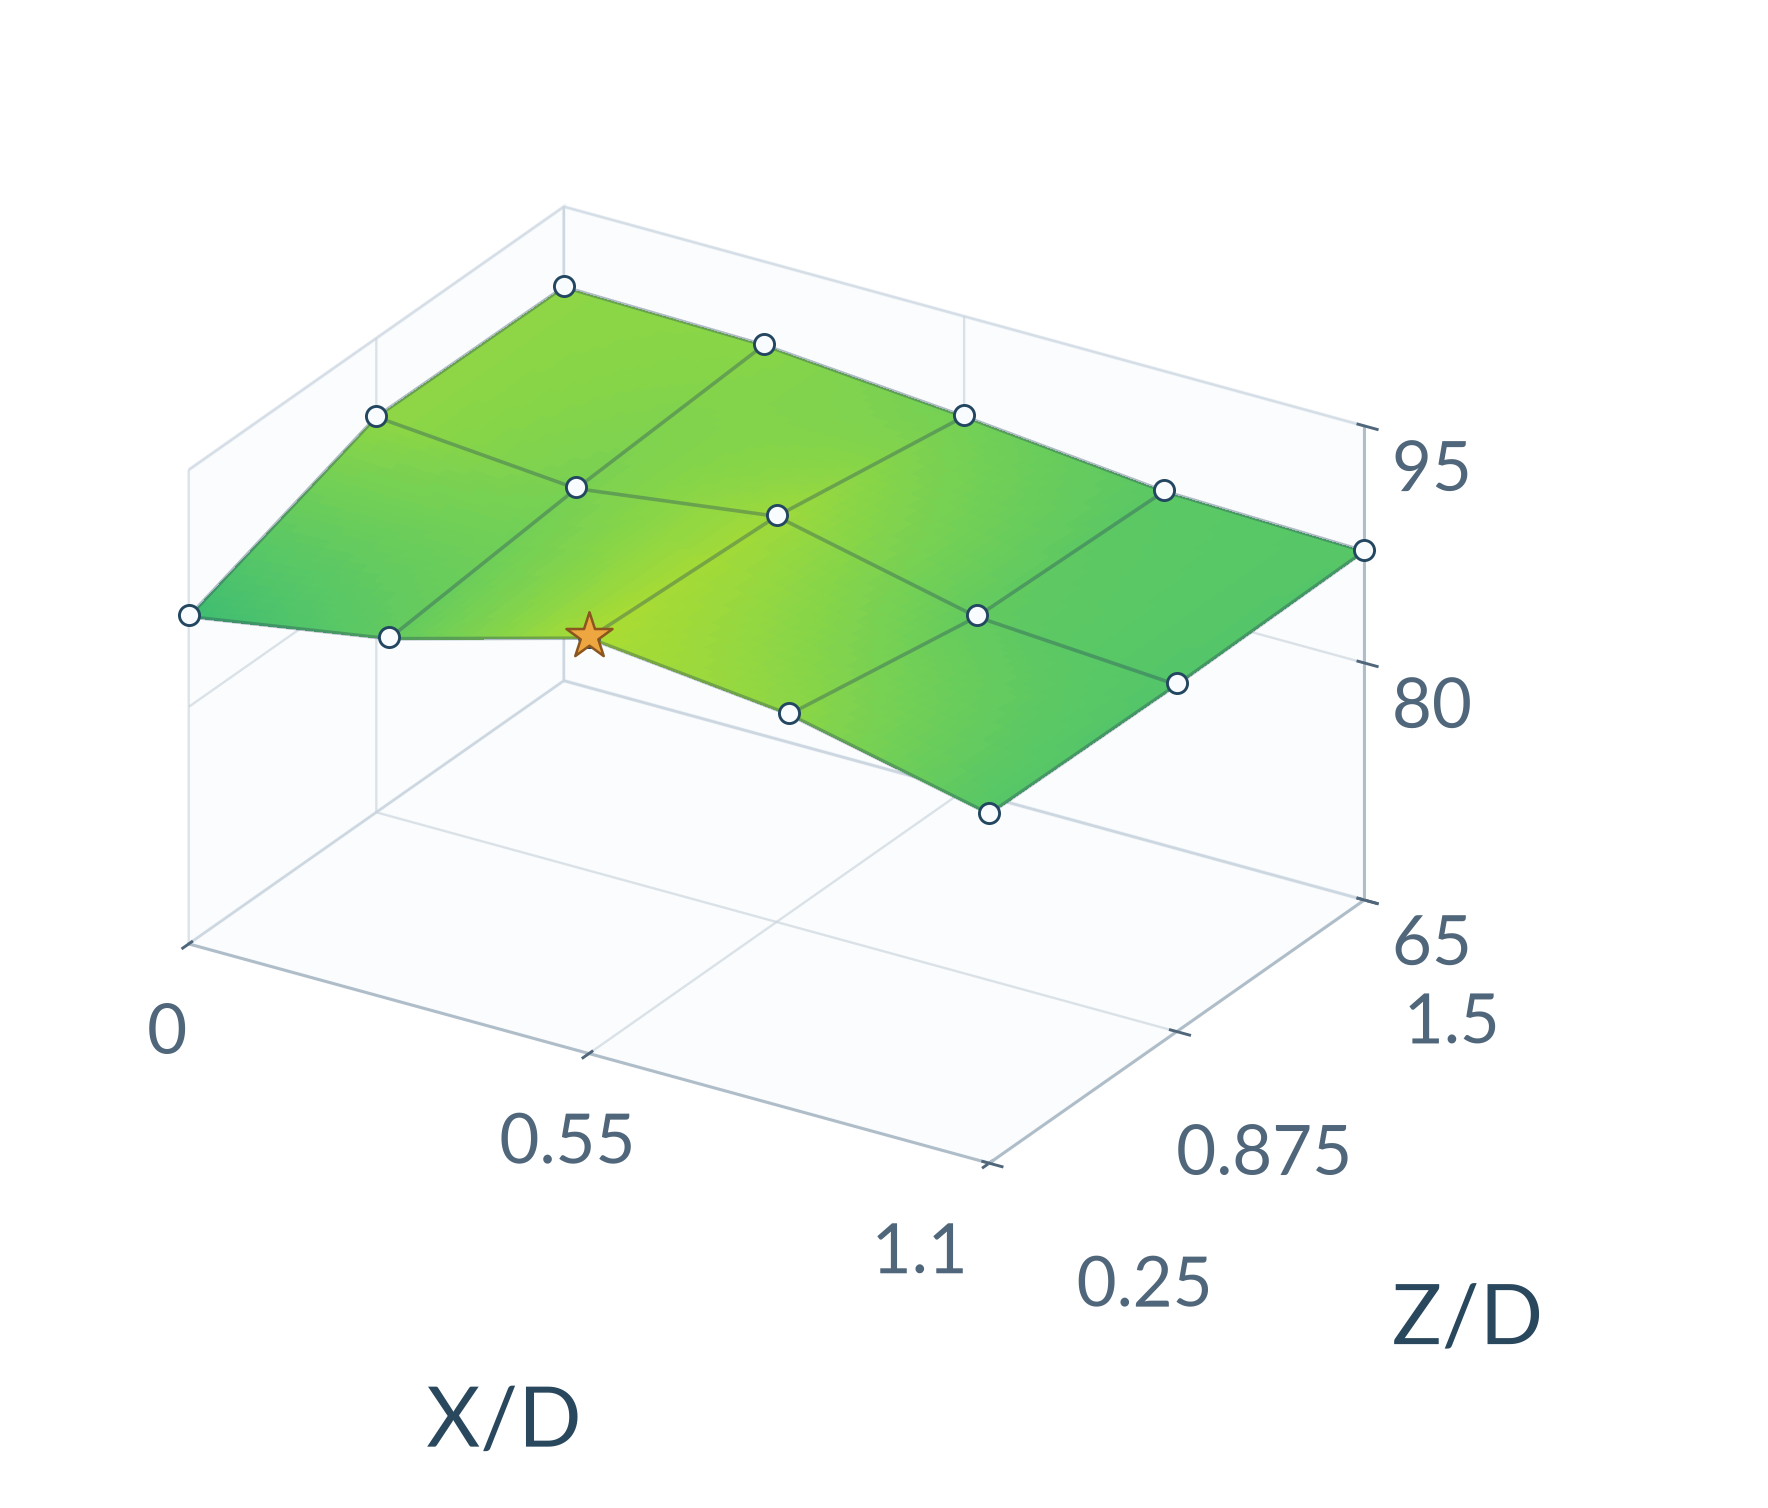
D = 40 cm

2,566 rpm per rotor

Preliminary sound level surface for 40 cm propellers across lateral offset X/D and axial spacing Z/D

Average A weighted sound pressure level [dB(A)]

Shared color scale from 65 to 95 dB(A), from purple through green to yellow
Preliminary measurements at nearly matched tip Mach number, approximately 0.157. The plots share the same axes and color scale. Surfaces cover measured positions only; the 13 cm data end at Z/D = 0.875. Values are the arithmetic mean of nine reported microphone levels, including two repeated entries, as shown in the presentation.

At Z/D = 0.25, all three sizes share a sampled peak at X/D = 0.55. Next, I want to nail down that relationship with more experiments and see whether it can help predict the pattern at another scale.
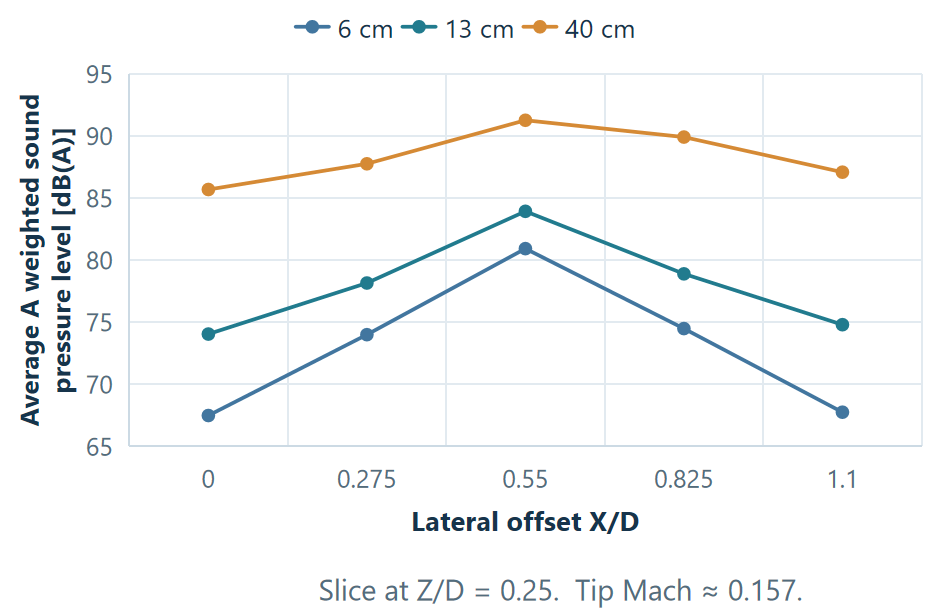
Line plot from slide 11 comparing the three propeller diameters, with a common sampled peak at lateral offset X/D of 0.55
A slice at Z/D = 0.25 makes the shared peak easier to see. These are preliminary results.

Sharing the work

I was honored to share this work as a speaker at the AIAA ASAT Annual Conference and at the UROP Symposium. At AIAA, I also joined our Blue Skies team for a group presentation alongside my individual talk.

Our Blue Skies team posing together at the AIAA Annual Conference
With our Blue Skies team at the AIAA Annual Conference.
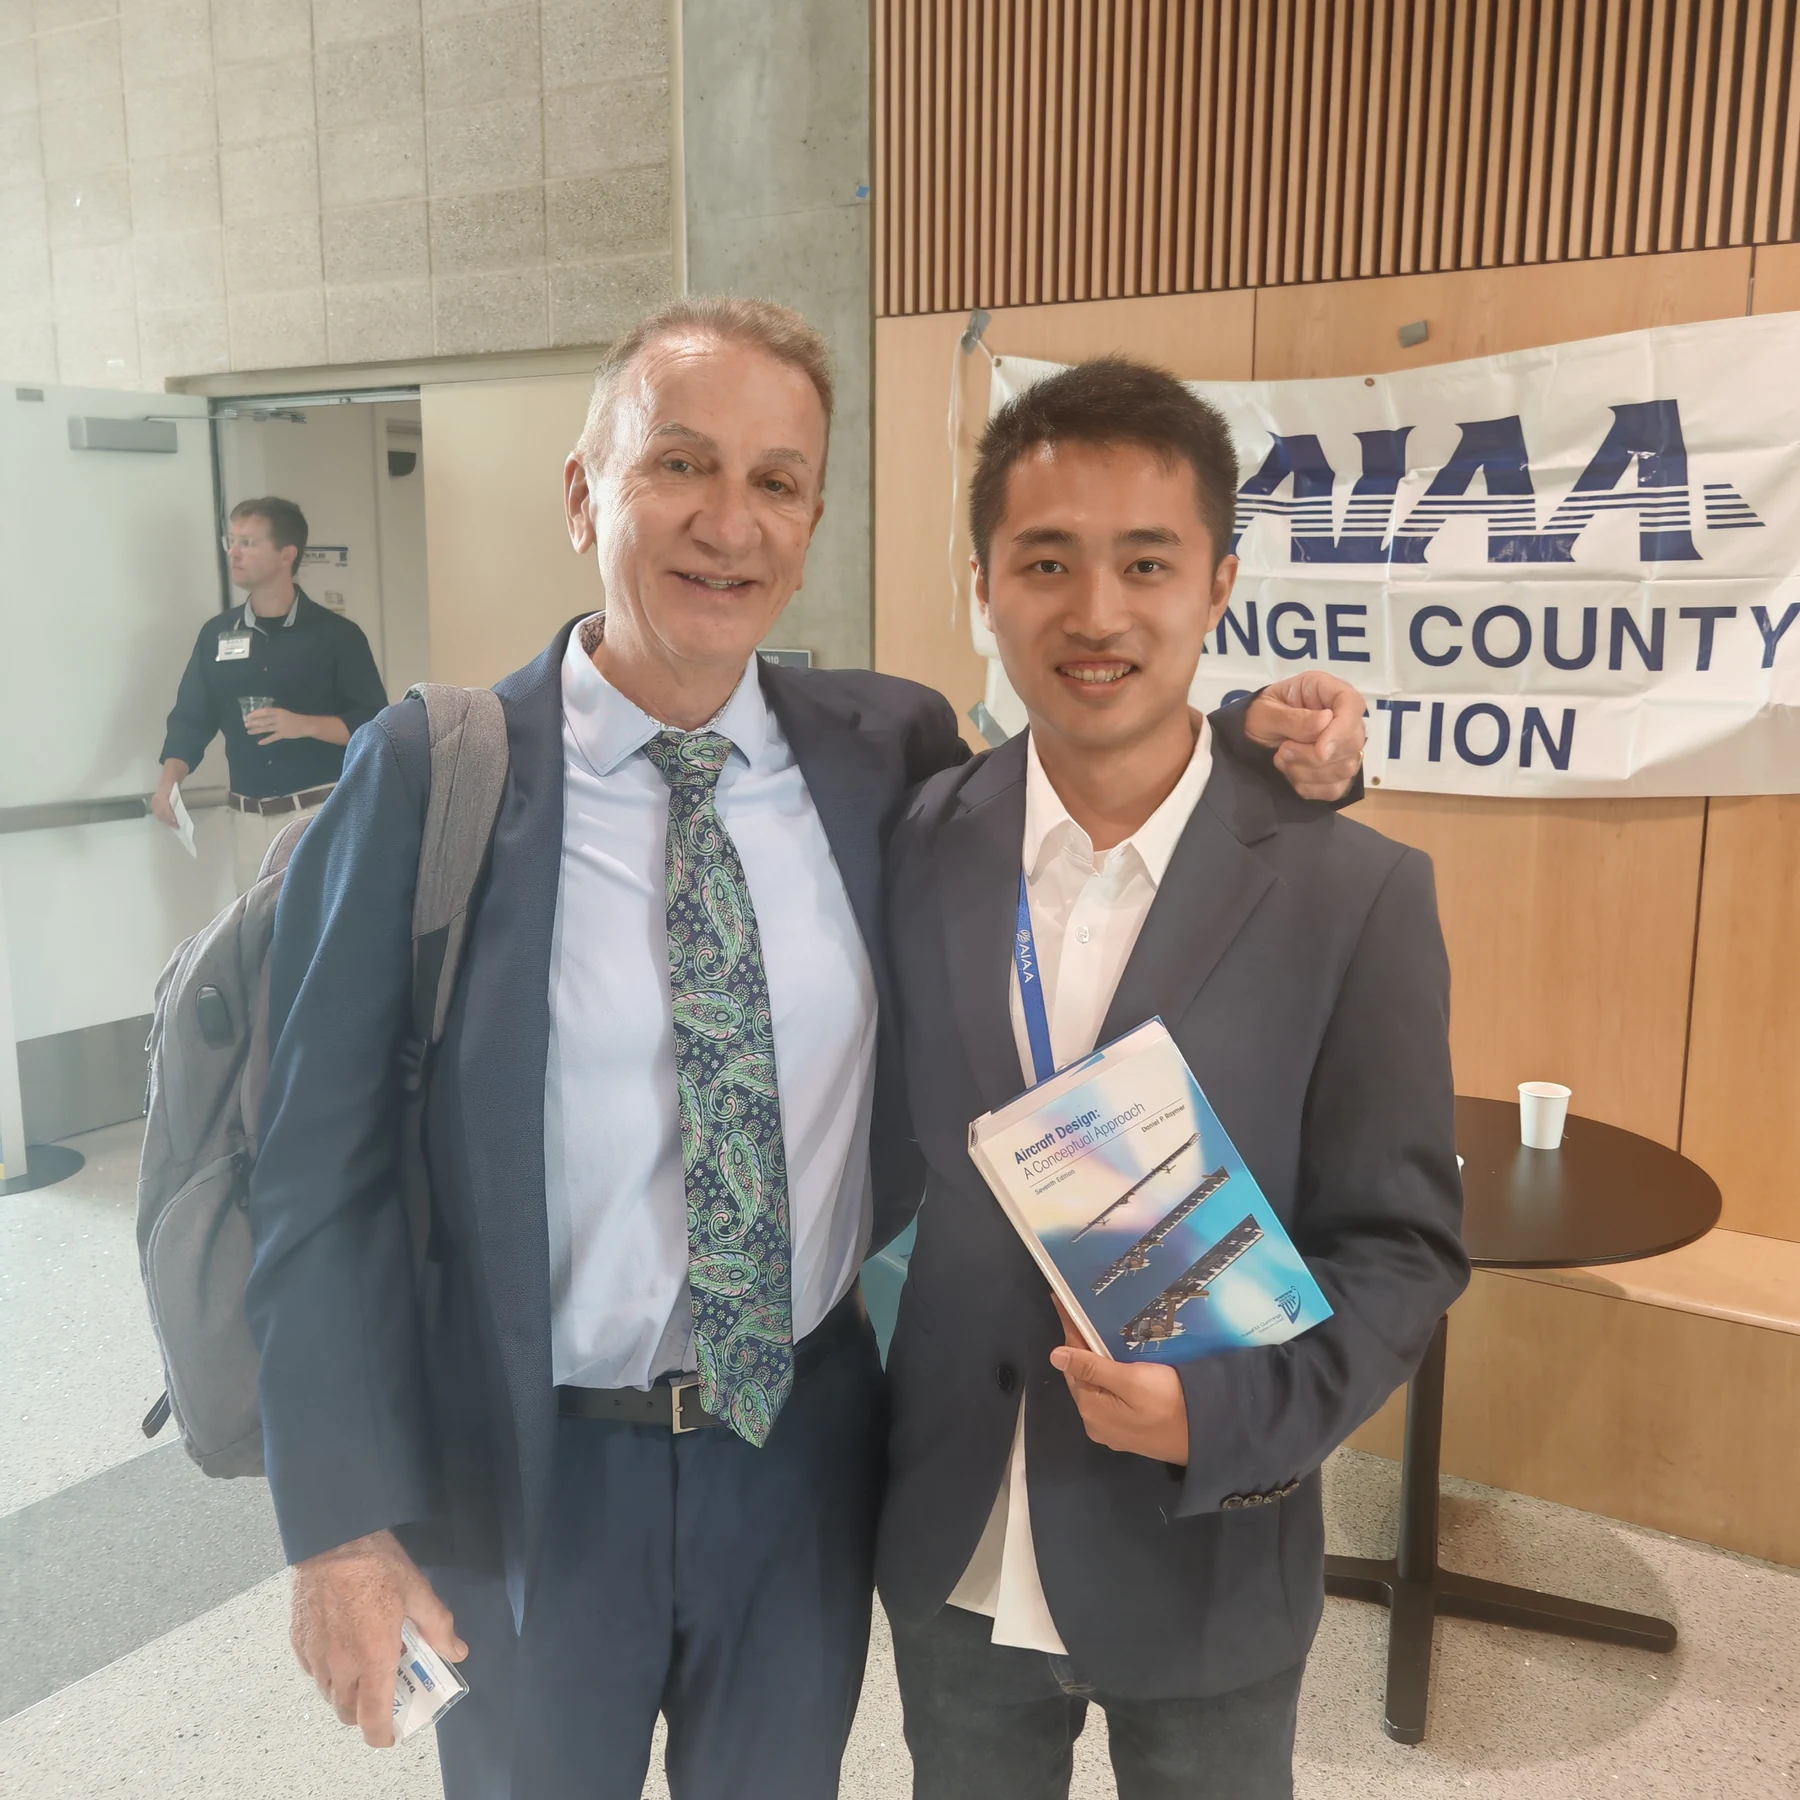
Me holding Aircraft Design and posing with its author at AIAA
I got to meet the author of Aircraft Design!
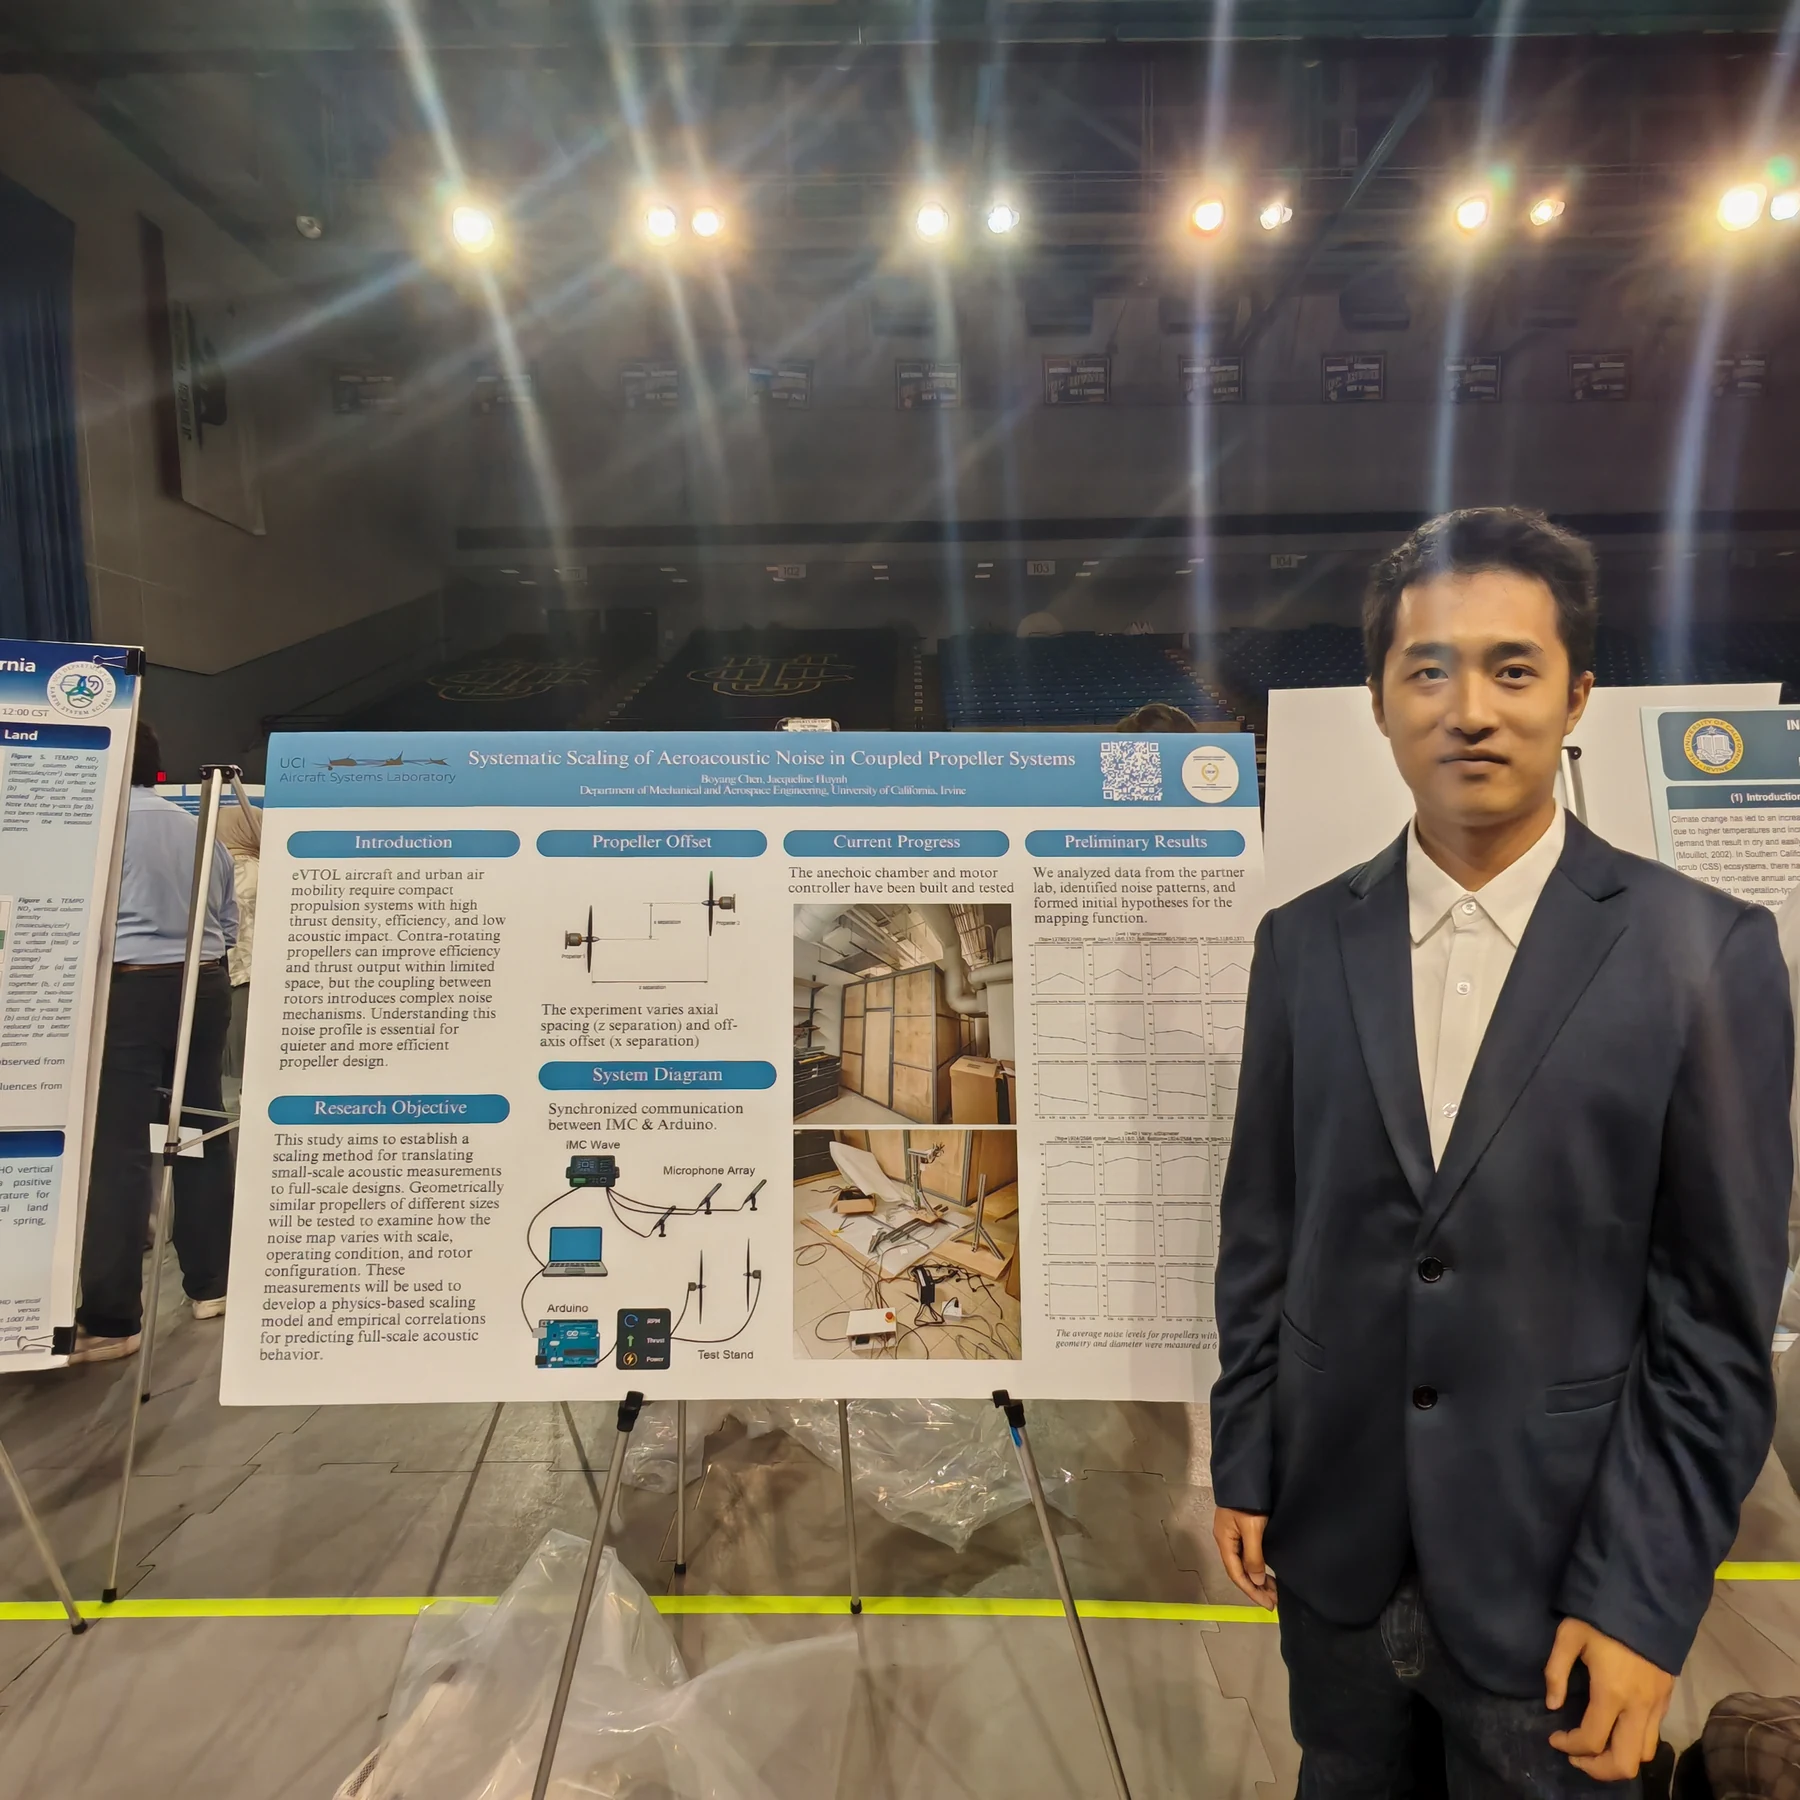
Me standing beside my propeller noise research poster at the UROP Symposium
With my poster at the UROP Symposium.
A selfie with friends who were also presenting at the UROP Symposium
Meeting up with friends who were also presenting at UROP.

The story is not over yet

The next step is full automation, with help from OpenAI. Once the system is ready, I will be able to put my hypothesis to the test. I am looking forward to seeing what comes next.